Welcome to the SecurityisFutile blog

I welcome comments and suggestions, I take criticism very lightly (at least most of the time). My goal for this blog is to document various experiments and research projects I feel are both relevant and prominent in the field of computer security (or lack there of) and share my results and experiences with other fellow computer security enthusiests. Most of my topics are based soley on open source technology and methodology, mostly due to availability and cost. I believe that effective security measures help keep people honest with their technology, for the most part. Security is futile (usless) or at least it feels that way when an inspired opportunist comes around and exploits your weaknesses. With that being said I leave you with a quote of inspiration; There is no security on this earth, there is only opportunity.-- General Douglas MacArthur

Friday, March 26, 2010

Simple Cross-Site Scripting (XSS) Techniques

Web application testing is essential in today's industry. Whether you work in the commercial, private, government sectors you need to ensure that both your data and your customer's data are protected by emerging and persistent threats. Cross-Site Scripting (XSS) vulnerabilities are caused by lack of proper input validation controls on the server (or the victims browser) for user-supplied input, usually executed through Java Script (once called Live Script). XSS vulnerabilities tend to lead to advanced social engineering attacks facilitated through Phishing scams, session hijacking, cookie theft and the list goes on. These threats are real and in order to protect your precious assets affected by these types of attacks you should employ some basic testing concepts when evaluating the security worthiness of your code. Here are some ways to test if your web application is lacking input validation controls:

( I do not condone unethical hacking. Use at your own risk!!!)

Demonstration
Test if parameters passed through a URL are susceptible to XSS attacks. Substitute my examples below for the web application and URL fields/parameters you are evaluating.

Initial Testing


Now substitute the value of the "user=" parameter with some injected java script


If the "user=" parameter does not supply any input validation from the server and the browser allows the java script injection your web browser will be populated with the web source code from the login.jsp page.

Additional Testing
I have found that a good bit of the XSS demonstrations and examples on the web show you how to execute java script in a vulnerable web parameter/field to display the alert pop up window with some random text. Assuming one of your parameters was vulnerable to the java script injection above in Example 1, lets try popping some alert messages using that same parameter/field, just substitute the value for "user=" with the following:


Varying Results and Considerations
There are many variables to consider when performing these types of tests.

1.)Not all web browsers will produce the same expected output. Microsoft Internet Explorer, Firefox, Safari, and so forth may not respond the same way to these tests. It is important to test the vulnerability in different browsers/versions of browsers to see which are and are not susceptible to the vulnerability.

2.) NoScript (Free Mozilla web browser product plug in) and other preemptive script blocking techniques are ways to mitigate these types of attacks. Enabling these features could alter or vary your expected results. However, these features are essential in protecting your assets against these types of issues.


Sources and Worthy Reading Material

OWASP: XSS Cheat Sheet
http://www.owasp.org/index.ph/XSS_%28Cross_Site_Scripting%29_Prevention_Cheat_Sheet

FireBlog: (Image used at the beginning of post)
http://www.fireblog.com/wp-content/uploads/2009/04/xss-threat3.jpg

Thursday, March 25, 2010

Splunk for OSSEC, theres an app for that!

Over the past couple of months I have invested a lot of time into researching and developing a suitable centralized security event management (SEM) solution for the enterprise, mostly powered by OSSEC and Splunk. Before today, I was using the default Splunk "Search" app with customized dash boards, reports and views as the front end UI to manage and monitor my OSSEC alerts. However, I still found myself wanting more features available to enrich my analytical capabilites when using Splunk to investigate my SEM data. So I turned to the Splunk community for answers.

When I started researching some of the applications found on http://splunkbase.com I was happy to see that Paul Southerington had recently posted/developed an app on the web site to support advanced parsing logic, saved searches, and dashboards for monitoring OSSEC alerts in Splunk. Now I use the add-on "Splunk for OSSEC" app to managed my OSSEC security alerts. And the best part...its FREE (one of my favorite words)! So yes folks, as Apple would say....theres an app for that!

How to set it up

The "Splunk for OSSEC" app was developed as an "add-on", such that you could install/extract the contents of the app ("ossec" directory) into the $SPLUNK_HOME/etc/apps directory so you could use the views/searches/reports globally within Splunk. However, I will walk through the process of setting this new app up under a new Splunk App, with private or restricted views (may require additional configuration changes to ensure the features of this app are isolated from all other Splunk apps you may have on your server).

(Follow at your own RISK!!!)

Requirements
  • Requires OSSEC HIDS/Agent already setup/configured
  • Requires working Splunk v4.0.XX server (recomend 4.0.7+)
  • Requires OSSEC syslog forwarding configured and talking to Splunk (see my sprevious blog postings for more details on how to set this up)
  • Enable data input specified in "Splunk for OSSEC" app "inputs.conf" (udp:10002 sourcetype:ossec)
Getting it working
  1. Download Splunk for OSSEC from splunk base website: http://www.splunkbase.com/apps/All/4.x/App/app:Splunk+for+OSSEC+%28Splunk+v4+version%29..must have a valid Splunk users account on splunk website
  2. Log into splunk
  3. Go to Manager > Apps
  4. Click on Create app...
  5. Enter in a name for the new app (example: OSSEC)
  6. Enter in a Label (optional) will display in top left of page as "splunk>(your label)" and is used to identify your new splunk app(Example: OSSEC Alert Manager)
  7. Enter in Author (option)
  8. Click "Yes" radio button to make app visible
  9. Enter in a Description (example: UI for monitoring OSSEC alerts)
  10. Select "barebones" as a Template
  11. Click --> Save
  12. Now open up a terminal shell window on the Splunk server
  13. Extract the "ossec.tgz" compressed archive in the Splunk apps directory, as root
  14. Command: # tar zxf ossec.tgz -C $HOME; cp -rf $HOME/ossec/* $SPLUNK_HOME/etc/apps/Name of Splunk App
  15. Restart Splunk!
  16. Generate some OSSEC alert data, either from one of your OSSEC agents or the OSSEC server itself
  17. Now go back over to your Splunk Web UI in your browser
  18. From the Launcher panel, or from the "App" drop down list(on top right hand side of page) find the Label name you gave your new app and click the name (example: OSSEC Alert Manager)
  19. Click on "Views", "Searches & Reports" and "Dashboards" to see the new add-on features for your new app
  20. Check out the splunkbase page for this new app for additional details and configuration options, like monitoring the status of your agents in a dashboard window...pretty neat!!
You may find that some of the features work and some don't. I am using Splunk v4.0.6 (even though this version is not recommended) and found that for the most part everything works. I am sure Paul Southerington put a good bit of TLC into this product and I give him a lot of credit for what he has done.
Fixing Known Issues
Question: Why don't the new searches for this app work?
Answer: For some reason, at least if you are using Splunk v4.0.6, the saved searches for the "Splunk for OSSEC" app did not work for my install. Here is what I did to get them to work properly:
* Note: (You may have to do this for each search you have....it can be a pain!)

  1. In Splunk, go to Manager --> Searches and reports
  2. Click on the search (example: OSSEC Rebuild OSSEC Server Lookup Table) that is not working
  3. Copy the search string (note the search name...you will need it for one of the steps below)
  4. Delete/Disable the search
  5. Go to your new apps search window (the app hosting "Splunk for OSSEC") by clicking on "Search" from the menu/header
  6. Paste the search string you copied in step 3 above
  7. Click on "All time" as your date range to search for
  8. If the search returned successful, save the search using the original name for that search (noted in step 3 above)
  9. assign the description, label name, time range and permissions appropriate for your setup
  10. Now try to access the stored search from within "Searches & Reports"
  11. Your search should work correctly now! You should ensure that the OSSEC - Rebuild OSSEC Server Lookup Table search is working correctly, other wise some of the views, searches and OSSEC dashboard features will not function correctly if the ".csv" file has not been populated with your OSSEC HIDS server host names.
Happy Spelunking!!!

Thursday, February 25, 2010

Creating your own Splunk> field using regex

Regular expressions are fairly easy to use and manipulate when searching through a series of data. I ingest all of my OSSEC alerts into Splunk and can search and drill down into the data with a click of a button. However, I thought it would be neat to build my own Splunk 'Field' using a regex (regular expression) based on the OSSEC Rule and the correlated event that occured on my systems. Then build a Splunk report on the data every 24hrs. The process is simple:

Create the Search --> Save the Search --> Build a Report

Create the Search
- Search path field in Splunk>


(This will search through all the data in your indexes and build a custom"OSSEC_RULE" field within your search criteria. The OSSEC_RULE field will specify each reported "Rule: ????" from your OSSEC alerts)

- Select "Last 24 hours" from time line drop down menu

- Click the green arrow to perform your search!

- When the alerts start building into your page you will notice the "OSSEC_RULE" field on the left hand side of your Splunk Search page, along with the other fields.

- If it is not there, click on the "All ??? fields" link, locate the OSSEC_RULE field, click on the green arrow to add it to your "Selected fields" and click the "Save" button. Now you should see the OSSEC_RULE field on the left hand side. If you still don't see it, check and make sure search criteria is correct.


Save the Search
- Now click on "Save search" located on the top right of the Splunk Search page

- Create a custom Name, Description, Time range and click the "Schedule this search" check box, then click the Save button


Build a Report
- Now click on "Build report" located next to the Save Search link

- Click the "Define report data through a form" link

- Select 24hrs from the Time Range dropdown menu, then click the Next button to format the report

- In the Report type drop down menu select "Rare values"

- Now select "OSSEC_RULE" from the drop down menu for the specific Field to use for the report

- Click the "Next Step" button to format the report
(Check out all of the OSSEC Rules that were found in your Splunk system...kind of cool)

- Choose the Chart type, Chart title, click apply then click the "Save" button on the top menu

- Create a Name, Description, Time Range then click "Schedule this search".

- Select the Schedule Type alert conditions and actions, then click Save

- Now you will be able to add this report to your dashboard or based on the action you select, run a script when a condition is met or email the report

Simple as pie!

Sunday, February 21, 2010

HTPC made simple with Element 1.0

ElementOS
Element v1.0 is a linux-based operating system (based on Ubuntu) for you Home Theater PC (HTPC) featuring a ten-foot user interface that is designed to be connected to your HDTV for a digital media and internet experience within the comforts of your own living room or entertainment area. I recently evaluated the product to see if was suitable enough for the average home PC user. You can get the latest Element OS from http://www.elementmypc.com. Version 1.0 comes with many different home PC features to help you manage internet media, games, music, video and photos.

The built-in media center application is XBMC (Xbox media center). However, you can download and install other media center apps like Boxee, Moovida and Hulu. These applications can also be downloaded from the element web site. Element provides its users with a full fledged computing and home entertainment experience. After evaluating the product I wouldn't see it being to difficult for the average PC user to figure out. I could also see myself replacing my cable and DVD boxes at home with a new HTPC.

How To Set it up
I used a Virtual environment to install/test the Element OS. I was pretty surprised how well it ran with a 10GB hard drive, single processor and 1024mb of memory. However, I would not recommend this for an official HTPC. You can find the minimum/recommended requirements for running Element on their website.

1.) I downloaded the Element v1.0 iso image (Live CD) from the Element website

2.) Then built my virtual machine using VMware Player v3.0
- 32bit Ubuntu
- 1024 mb
- 10 GB hard drive
- Host-only network (will allow you to get out on the Internet from your Host computer)

3.) After configuration was complete I setup my virtual machine to boot from the iso image I just downloaded

4.) Then log in to Element using username "element" with no password

5.) Then install the Element operating system to the virtual machine's hard drive.
- Click the File Manager launcher on your center bar and then click the Install Element icon.

- This will walk you through the installation process

6.) Now install VMware tools so you can optimize your virtual machines performance

7.) In the virtual machine window, click "VM" and "Install VMware Tools"
- follow the install instructions
- reboot your virtual machine

8.) Now configure your display, click on the Element "Application Finder" in the top left hand part of your screen

9.) Click on the "Settings" radio button then double-click "Display"
- optimal 1262x658
- logout then log back in or reboot

10.) Now you are ready to install some other media desktop apps, surf the web or do what ever! You could even try connecting it to your TV using a converter for AV inputs or HDMI.

References

-User Forum
http://www.getsatisfaction.com/elementos/topics

- Official web site
http://www.elementmypc.com/main/mainpage

Wednesday, December 9, 2009

Spelunking with splunk> & OSSMS

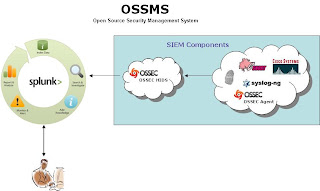
The purpose of this exercise is to simulate the integration of SIEM (Security Information and Event Management) data into an enterprise indexing repository where we can analyze, generate reports and correlate security relevant events through the use of regular expressions. The ideal goal is to try and build a free OSSMS (Open Source Security Management System). The SIEM devices sit on the border and internal segments of the network and report violations based on the security policy then take corrective action as necessary. Those alerts are forwarded to a filter device; OSSEC HIDS (Host-based Intrusion Detection System) in our scenario that separates our security relevant data from our SIEM devices, in the form of alerts and severity levels based on our organizational security policy, then ingest those events into our indexing engine, Splunk. This way we can filter out any unnecessary alerts/data and pull back only what we want, in a controlled fashion (to help stay within the 500MB of data per day budget and help keep the costs of the Splunk license to $0 to help sustain our free open source security management system). In the end, Splunk should help to enrich the security analysts experience by providing a faster and more efficient way to retrieve, search and query SIEM data from a central location, or across multiple Splunk repositories through its distributed search capability.

Here is my test scenerio, an OSSEC HIDS forwarding alerts to a Splunk server on the same network. Here is what you need to do from a test/configuration stand point:

Setup the OSSEC server
- Install / configure CentOS5

- Download install ossec v1.6 or 2.3
(This is a generic installation, so just accept all of the defaults when running the install.sh script. Read installation files for additional information)

- Inside ossec.conf add a syslog_output block specifying your Splunk system IP address and the port it is listening on: (can be changed to what ever you configuration allows for)


- Now you need to enable the syslog_output module and restart OSSEC:
#/var/ossec/bin/ossec-control enable client-syslog
#/var/ossec/bin/ossec-control restart


-----------------------------------------------------------

Setup SPLUNK
- Install / configure CentOS 5 (I used Ubuntu v9.10 in a VM since I only had one processesor any way)

- Download SPLUNK v4.0.6 tar ball for i386 or 64bit Linux to root's home directory

- Extract the .tar ball in the /opt directory (creates directory /opt/splunk)
# cp $HOME/splunk_linux_name.tar /opt;tar xf /opt/splunk_linux_name.tar

- Make sure you update any local or network firewalls that this communication is traversing and then restart Splunk.
# $SPLUNK_HOME/bin/splunk restart

(Accept the license agreement)
- Open browser and go to http://serverip:8000
* user: admin
*password: changeme

-----------------------------------------------------------

Splunk Configuration
· On the main dash board page, click the Manager link in the top right hand corner of the page

· Under “System Configurations” click on the Data Inputs link

· Click on the UDP link, then click the New button

· Enter the port number (10002 or what ever you entered in during the OSSEC configuration for the port SPLUNK will receive OSSEC alerts from)

· Select “Manual” from the dropdown box pertaining to source type

· Enter in “ossec” in the Source Type text box, then click the Save button

· Now you must enable the data input feed for the port by clicking on the enable link in the row that corresponds to your new UDP port/feed for OSSEC

· Click on the Back to Search link in the top left hand corner of the web browser, generate some alerts from the OSSEC server (or your OSSEC agents) and the alerts should be arriving into SPLUNK soon!!!!

Happy Splunking!!!!!


RESOURCES:
http://www.ossec.net/main/splunk-ossec-integration

http://www.splunk.com/base/Documentation/latest/Installation/InstallonLinux#Tarball_install

Monday, November 16, 2009

http browser autopwn

At the Defcon conference this year a new exploit was provided to the open source hacking community (Thanks to Egypt - Thank You), which allows one to fingerprint the victims browser/OS and patch levels prior to sending the exploit. Previously the exploit was chartered as a Cluster Bomb but is now known more of a guided missile.

I was able to test this exploit against a vulnerable microshaft IE 6.0.3 browser this afternoon and the payload exploited with out a hitch! If you like watching videos here is a good proof of concept you can develop your future exploits from off of youtube:

(PaulDotCom Enterprises, LLC)
http://www.youtube.com/watch?v=FwBDTg7W1wY

Just run the Metasploit console and load the /auxiliary/server/browser_autopwn exploit module then set values for:

LHOST (IP victim will connect back to)

SRVPORT (port to run exploit on, can be 80 or 443 HTTPS)

URIPATH (directory to host exploit from)

run exploit, connect from victims vulnerable browser to http://(IP)/(URIPATH) and the exploit should launch, results should start to show over in MSF console window. Once a session is generated you are in using the privileges as the victim (now you can quickly escalate privileges to system/admin/root)

Test:
sessions -l (session ids should list)
sessions -i (session id), then type: hashdump, ipconfig /all, ifconfig -a (what ever)

if not then try again. I had some problems when the browser sent a response the server didn't know how to respond to (sent RST and 404 message back to client usually when victims browsers doesn't have a plugin installed), like apple quicktime, java or something like that). Take out those checks done by the exploit in the ruby code and you might have some success!!! I didn't test with a anti-virus scanner installed, but I have heard it can bypass/evade some of the scanners and generic IDS rules based on how you submit your exploit to the victim. This is definitely an effective means of getting inside through a phishing attack.

NMAP XML Parser

Recently I took on the challenge to write my own python DOM parser ,to take the output of an NMAP SYN scan and parse the results into a database of choice, like MySQL. After doing some preliminary checking of what is already out on the web I came across a tool developed by http://www.tssci-security.com that will handle just what I was looking for. Once you make some tweaks to the code to parse out the "ipaddr" for both the MAC and the IP addresses the python script "nmapxmlparse.py" works like a champ! It outputs the NMAP xml formated file into a ingestable .csv file, which can then be scripted to insert into your MySQL tables.